Reports of Tremor Activity Monitoring System (TAMS)
To better recognize the occurrence of an ETS event during its early stage, the Geological Survey of Canada (GSC) establishes the Tremor Activity Monitoring System (TAMS) in northern Cascadia. TAMS consists of three major modules. The Waveform Retrieval Module works with GSC's real-time seismic acquisition system to fetch required waveforms. The Waveform Analysis Module performs data processing, key-parameter calculations, tremor pattern recognition, and quantitative evaluation of the activity level for a set of predefined sub-regions. The Information Delivery Module handles the post-analysis tasks, including archiving results, preparing summary reports in both text and graphic formats, and delivering them to network operators and researchers. When a high level of tremor activity is detected, an alert message is sent to a pre-compiled list of clients consisting of GSC management and scientific teams, federal and provincial emergency agencies, research institutions in the region, and individuals who asked to be included. For more details about TAMS, please refer to the following papers:
Kao, H., P.J. Thomson, G. Rogers, H. Dragert, and G. Spence (2007), Automatic detection and characterization of seismic tremors in northern Canscadia, Geophys. Res. lett., 34, L16313, doi:10.1029/2007GL030822.
Kao, H., P.J. Thompson, S.-J. Shan, G. Rogers, H. Dragert, and G. Spence (2008), Tremor activity monitoring in northern Cascadia. EOS Trans., AGU, 89(42), 405-406.
For those who wishes to be included in the TAMS email list can send a request email to pgc_info@pgc.nrcan.gc.ca with a statement indicating his/her preference in either the "daily" or the "alert-only" group.
TAMS Daily Summaries for Vancouver Island
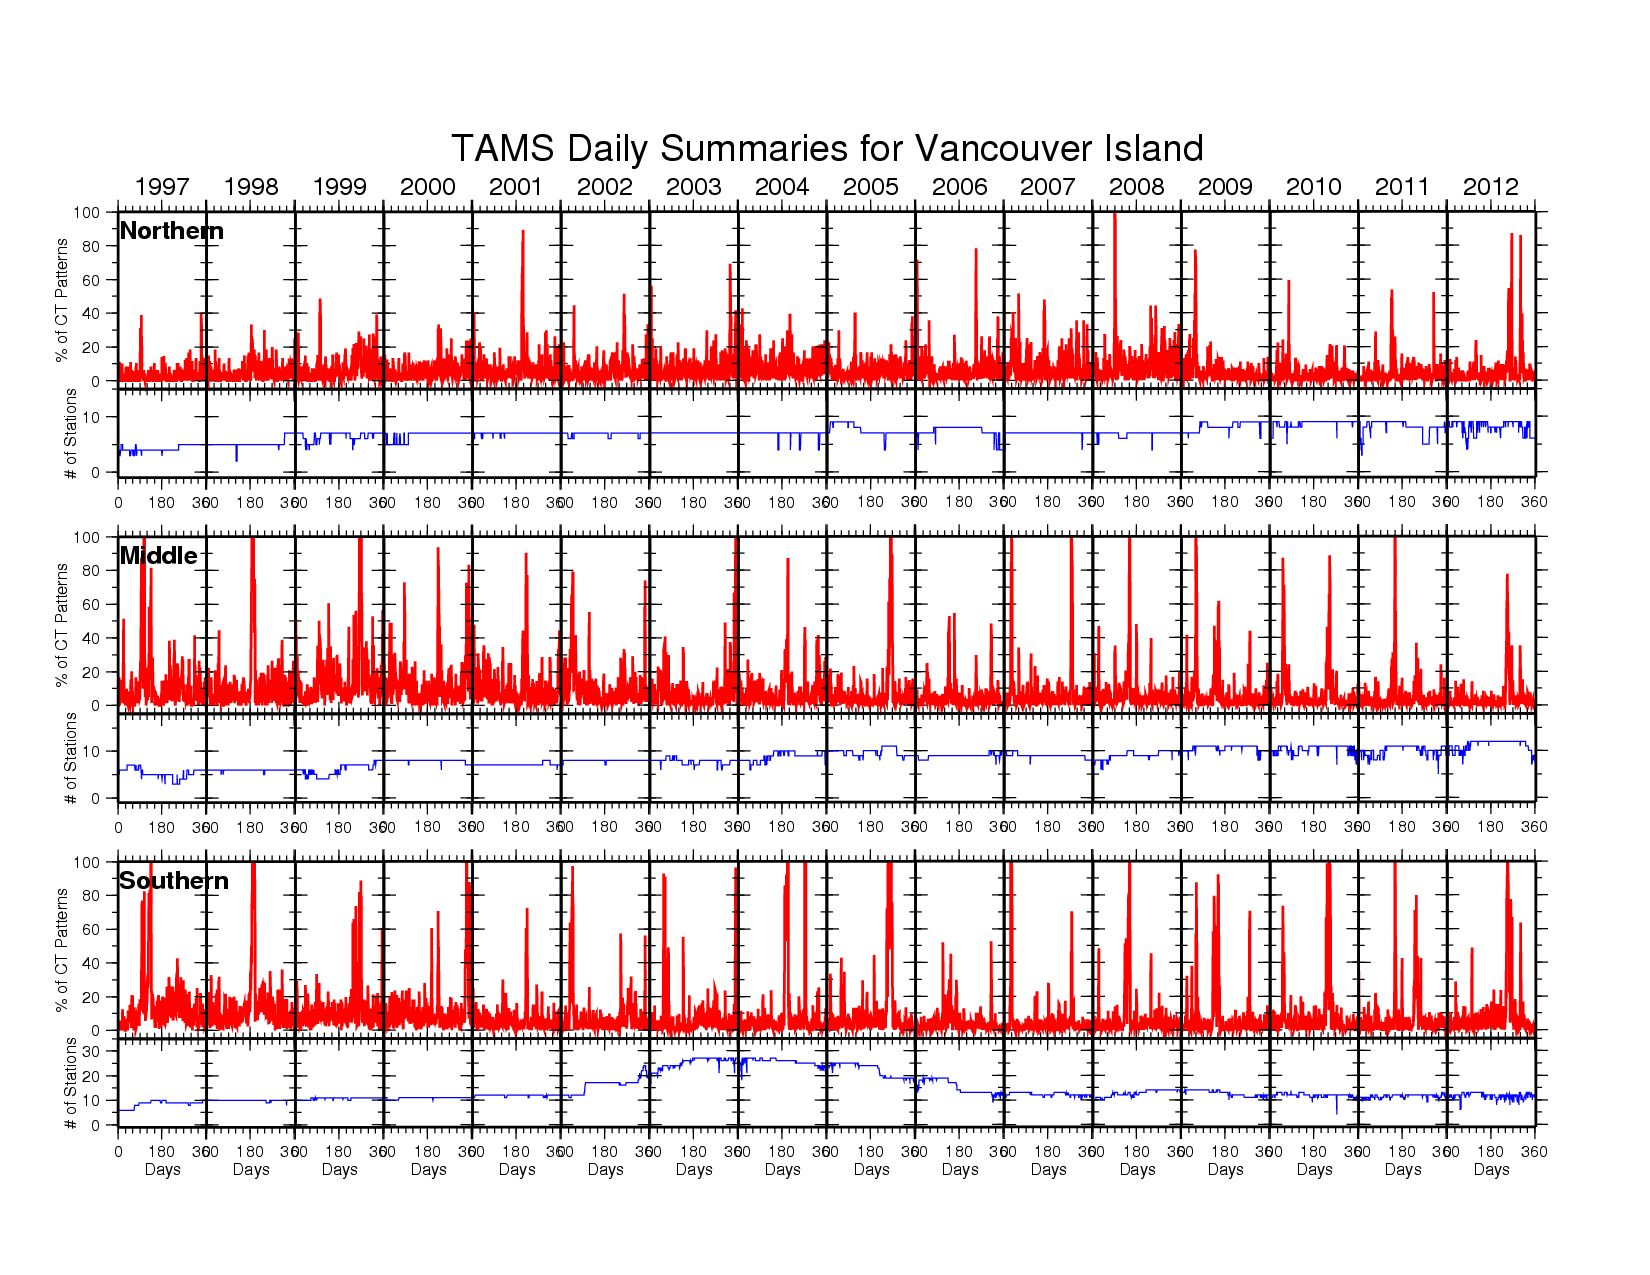
One of the main products of TAMS is a chart which plots the daily percentage of coherent tremor station-hours since the year of 1997, and it is displayed below. A coherent tremor station-hour is referred to a given station whose seismic waveforms exhibit coherent tremor patterns for a given hour. The percentage is defined as this Coherent Tremor (CT) station-hours against the total station-hours in a particular region (Southern, Middle or Northern Vancouver Island).
Skip to the text alternative below for the TAMS daily summaries for Vancouver Island
The chart is a composite plot to summarize the TAMS reports from 1997 to 2012 for Northern (top panel), Middle (middle panel) and Southern (bottom panel) Vancouver Island. In each panel the daily percentage of station-hours showing the coherent tremor (CT) pattern is marked by a thick red line plotted at the top, whereas the number of seismic stations available for TAMS analysis is shown by a blue line plotted in the middle. The horizontal axis at the bottom of this chart shows the number of days in each year since year 1997. Clicking the chart will bring a big magnified graph.
The number of seismic stations (plotted with the blue lines) used in the calculation ranges from 3 to 11 in the Northern Vancouver Island, from 4 to 15 in the Middle Vancouver Island, and from 5 to 34 in the Southern Vancouver Island. The daily percentage of station-hours (plotted with the red lines) showing the coherent tremor (CT) pattern varies, and peaks periodically. Comparative studies have shown that the periodic peaks in these charts match very well with the occurrences of major ETS events in Vancouver Island (VI). Recurrence interval of major ETS events in southern VI is remarkably regular at 14 months, whereas the interval in the north is significantly shorter (about 9 months). Since there is a big difference in the plate age and convergence rate between the north and south, our observation seems to suggest that ETS recurrences may be related to tectonic parameters. "Screen reader users, please turn on abbreviations in your settings."
TAMS Daily Summaries in Table Format
The table below provides the same information as in the above chart with the exception that the data are broken into one-year intervals. By selecting a different year, that year's data will be displayed accordingly.
| Date | Northern Vancouver Island | Middle Vancouver Island | Southern Vancouver Island | |||
|---|---|---|---|---|---|---|
| Percentage of Coherent tremor | Number of Stations | Percentage of Coherent tremor | Number of Stations | Percentage of Coherent tremor | Number of Stations | |
